 In our most recent webinar here at MADIC dynamics, we took a look at how to create a multi-company report in Jet Reports. This is a webinar which I presented.
If you want to catch up on this webinar, you can do so here.
- Introduction
- Multi-company data in reports
- Multi-company by columns
- Multi-company by sheets
- Consolidation sheet using INDIRECT function
- Conclusion
Introduction ^
Jet Reports is a third-party add-on for Microsoft Dynamics 365 Business Central which is widely used along side Business Central. It is popular because it is very flexible, allowing reports to be created against any table in Business Central, whether from a standard or third-party table. It can be used to create both financial and operational reports.
Many of the clients I work with have multiple companies in Business Central and therefore a need for multi-company reporting.
In this webinar I took a look at the way that the Jet functions can be used to pull data from multiple companies into a single report. The webinar focused primarily on doing so using the GL function, but the same can be done with the NL function.
Multi-company data in reports ^
When you build or run a Jet Report the data, if you do nothing to override it, will come from the default company specified in the company selection on the Excel action bar:
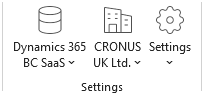
In my case I am connected to the CRONUS UK Ltd. company so all data will come from this company.
The best way to manage which report is used for data is to allow the user to pick a company or companies at runtime by adding a report option which includes a filter on the system Company (2000000006) table:
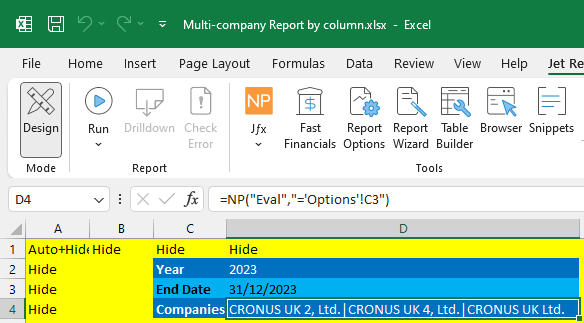
The selected company can be brought efficiently to the report tab using the NP(Eval”) function:

In the GL (or NL function, the company option on the reports sheet can be referenced in the Company field (in my case coded to a column/row locked $D$4):
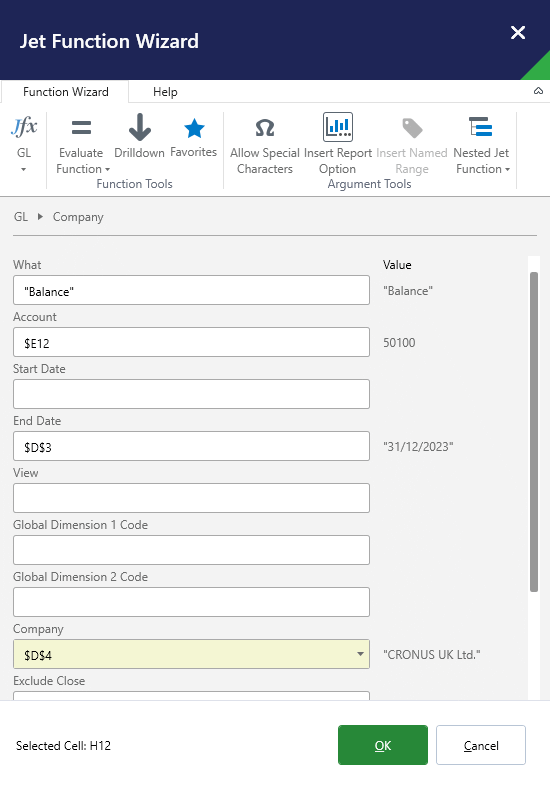
Building a report in this way allows you to ignore the default company at runtime and allow the user to select the company to use in the report; when building the report you need to reference the company in all functions to avoid inconsistencies.
Building a report in this way is also limited to a single company, although you could hardcode a company reference in a column and pull data from multiple companies into the report.
Multi-company by columns ^
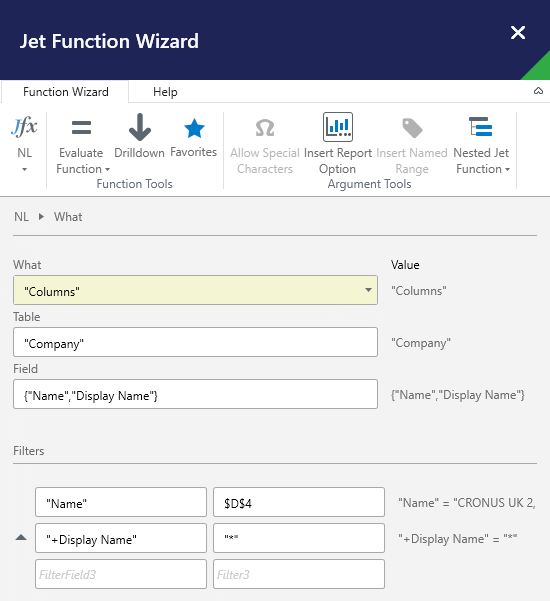
However, there is a way to automate the creation of a column per company, by using the Columns What in the NL function.
When users select a company in the report option, they can use the shift or control key to select multiple companies which can then be brought to the report tab for efficient use:
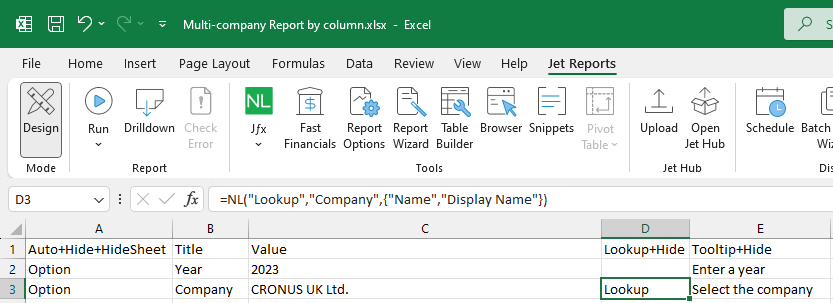
The NL columns option can be used to automatically generate a column for each company selected by the user; this can then be used to get the name and display name for use in the report:
Multi-company by sheets ^
In the same way [n]NL(“Columns”)[/b] can be used to generate a column per selected company, NL(“Sheets”){/b] can be used to generate one page per company:
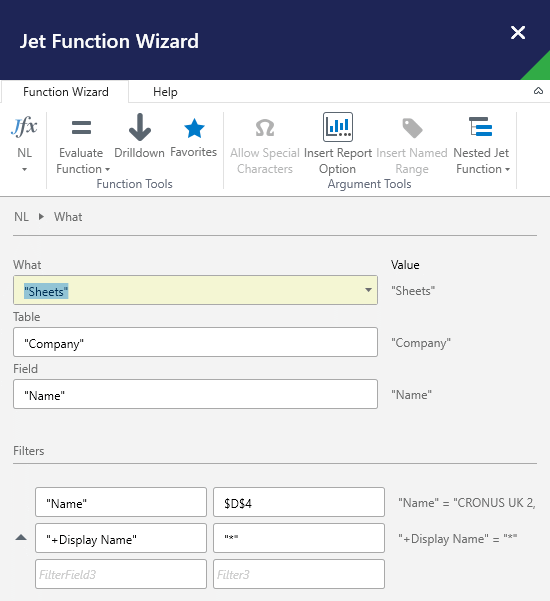
The sheets generated use the returned value from the Field column. Creating a report using the sheets function allows you to generate a clean report for each selected company, potentially with multiple columns for the company on that sheet.
Consolidation sheet using INDIRECT function ^
If you use the sheets function to create one sheet per company, you may also want to create a second worksheet oin the report workbook for a consolidation sheet. While you could use the columns function to list the companies and extract the data again, this is very wateful way of doing it as the data must be extracted twice.
Instead you can use a standard Excel function to pull the data from the other sheets as they are generated and then simply sum them up.
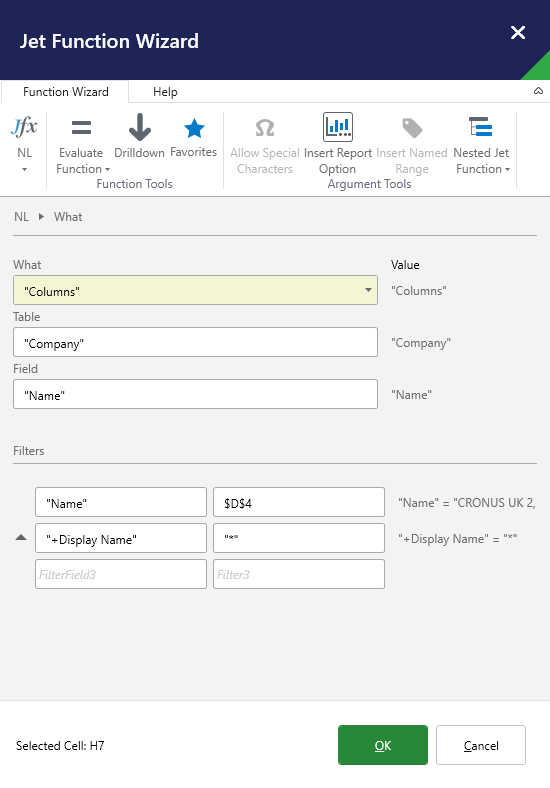
The way I would do this, is to use an NL(“Columns”) on the consolidation sheet to have a column per company:
Then on each row, I would use the standard Excel INDIRECT function to reference the sheet with the data for the company:
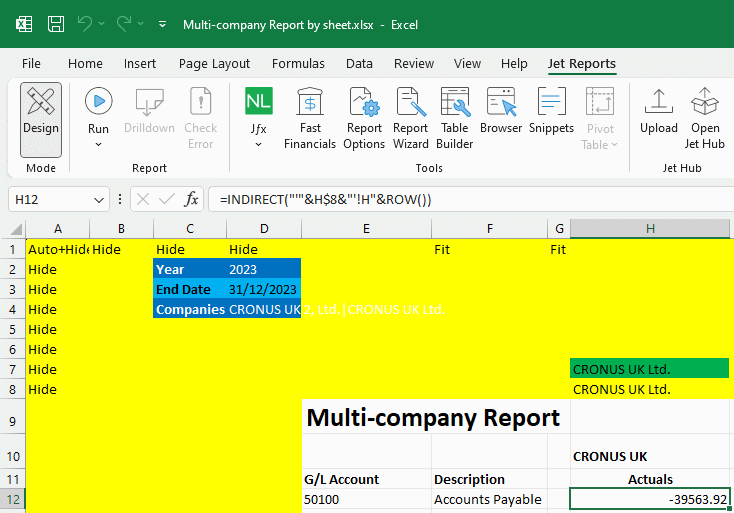
The above example, shows the INDIRECT function referencing a tab called CRONUS UK Ltd.[/b] in column H and row 12. You would replicate the INDIRECT formula down each row of the report and across multiple columns if you needed multiple columns per company (such as for actuals, periods, comparisons and so on)).
Conclusion ^
Some of the above may seem quite complicated, but it is fairly straightforward when broken down. In the webinar I stepped through all of the above in the webinar, building examples as I went so if you watch the recording you will be able to see exactly the process I went through to build the multi-company report using both the columns and sheets functions.
The webinar recording is available.
Click to show/hide the Series Index
What should we write about next?
If there is a topic which fits the typical ones of this site, which you would like to see me write about, please use the form, below, to submit your idea.