 In our most recent webinar here at MADIC dynamics, we took a look at Jet Reports & Business Central.
If you want to catch up on this webinar, you can do so here.
Introduction ^
In this webinar we took a look at Jet Reports & Business Central. Jet Reports is (probably) the leading reporting software which is used with Business Central, and NAV before BC.
It allows you to report from any table, standard or third party, from Business Central which means that you can do financial or operation reporting, and in a very flexible way.
This webinar introduced the basics of the tools available in Jet Reports, with specific reference and example of the Table Builder.
Available Tools ^
Jet Reports is a very flexible reporting package which makes it both very powerful, but also somewhat more on the complex end of things. However, it comes with a number of tools which can assist users creating reports quickly and easily.
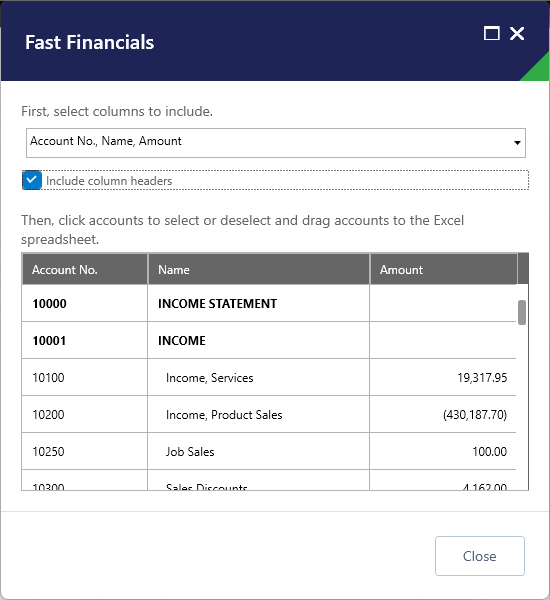
- Fast Financials which allows you to quickly create financial reports.
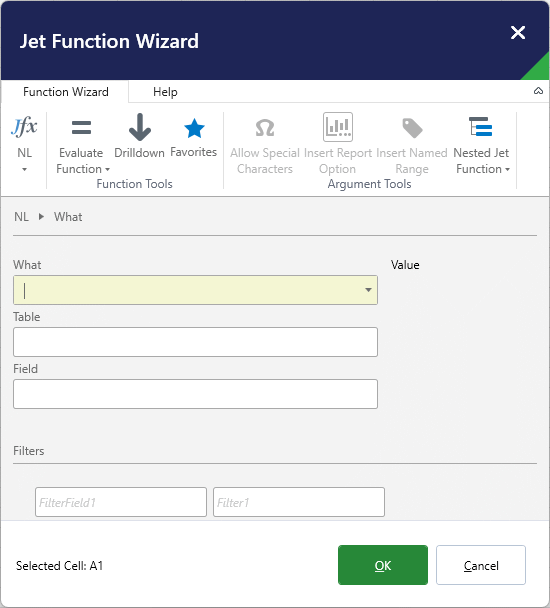
- Jet Function (Jfx) is the tool I use for building most reports as it offers the most flexibility, but is also the most complex.
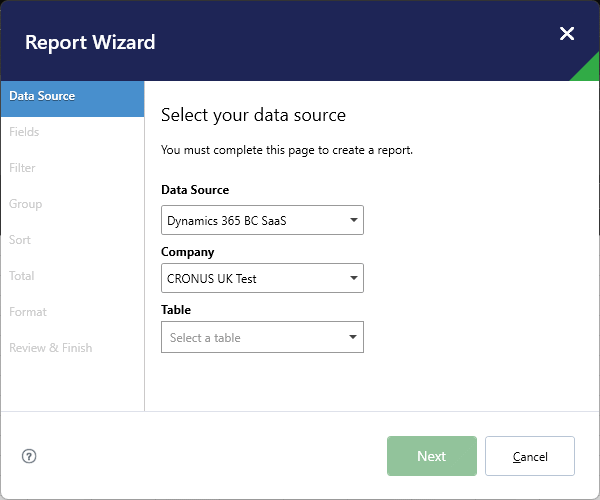
- Report Wizard allows you to create a report using a step-by-step wizard.
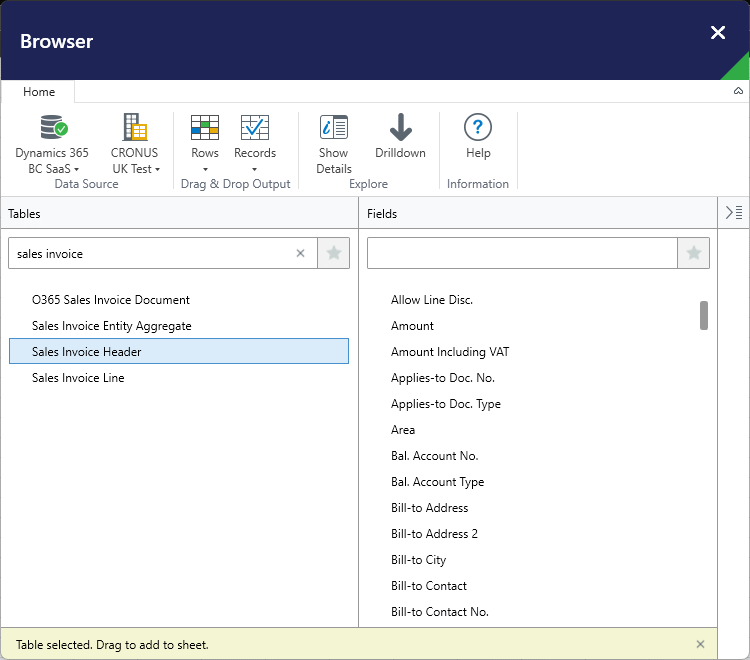
- Browser allows you to browse all fields and tables in Business Central.
- Table Builder allows you to build an Excel table populated with data from Business Central.
Fast Financials ^
Fast Financials allows you to quickly and very easily build, through drag-and-drop, a report on the financial in Business Central. You can choose to include budget information as well as the actuals and a variance column calculating the difference.
Quick to produce reports, but any change to the chart of account and you will need to use the tool again or manually update the report.
I generally use the Jet functions to create this type of report as you can write them in such a way that new accounts are automatically included.
Jet Function (Jfx) ^
The Jet function (Jfx) button gives you access to the functions needed to build any report. This is the most flexible, and most complex, way of writing reports with Jet reports; it should be noted, that all of the other tools are simply ways to automatically generate the Jet functions required for the report.
Report Wizard ^
The Report Wizard allows you to use a step-by-step wizard to create a Jet Report, but only from one table.
You can add groupings, filters and other functionality, but you are limited to only one table, which in a lot of cases means a report of sufficient complexity can’t be created.
Browser ^
The Browser allows you to see and browse a list of all available tables; when you select a table you can then browse a list of the columns on that table. Drag-and-drop can be used to add a field to the report, which adds the required NL Jet function. It is quite intelligent for adding the columns selected, but more understanding of the process of building reports would be gained by learning how to add the functions yourself.
Table Builder ^
Table Builder is quite a flexible tool for building reports and, as the nae suggests, builds a report in an Excel table, which gives you access to all of the usual table functionality in Excel, including the ability to use PivotTables against the table.
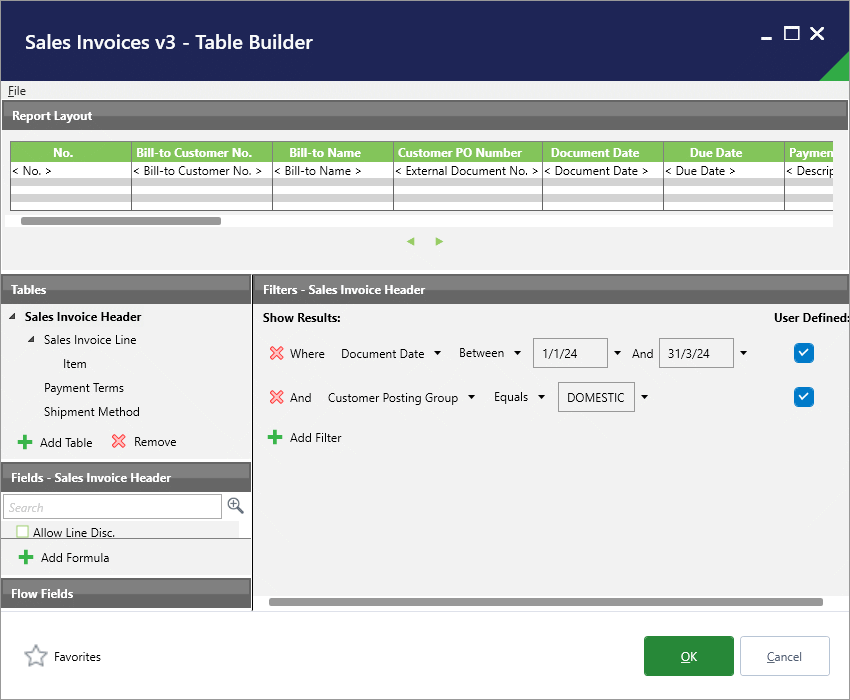
Table Builder allows you to add multiple tables, choosing which field from each table should be output.
You can amend the links between tables if necessary, although Jet generally does a good job of linking the tables together and decide if the first table should always be output or only when data in the joined table is present (inner/outer joins).
You can add filters to each of the selected tables, setting them as user defined so report options are added to the report for the user to set when running the report.
There is also quite a useful function for creating formulas, which I showed could be used to calculate the net weight of an order line.
The Table Builder definition can be saved for future changes; if you don’t save it then any change will require you to recreate the definition.
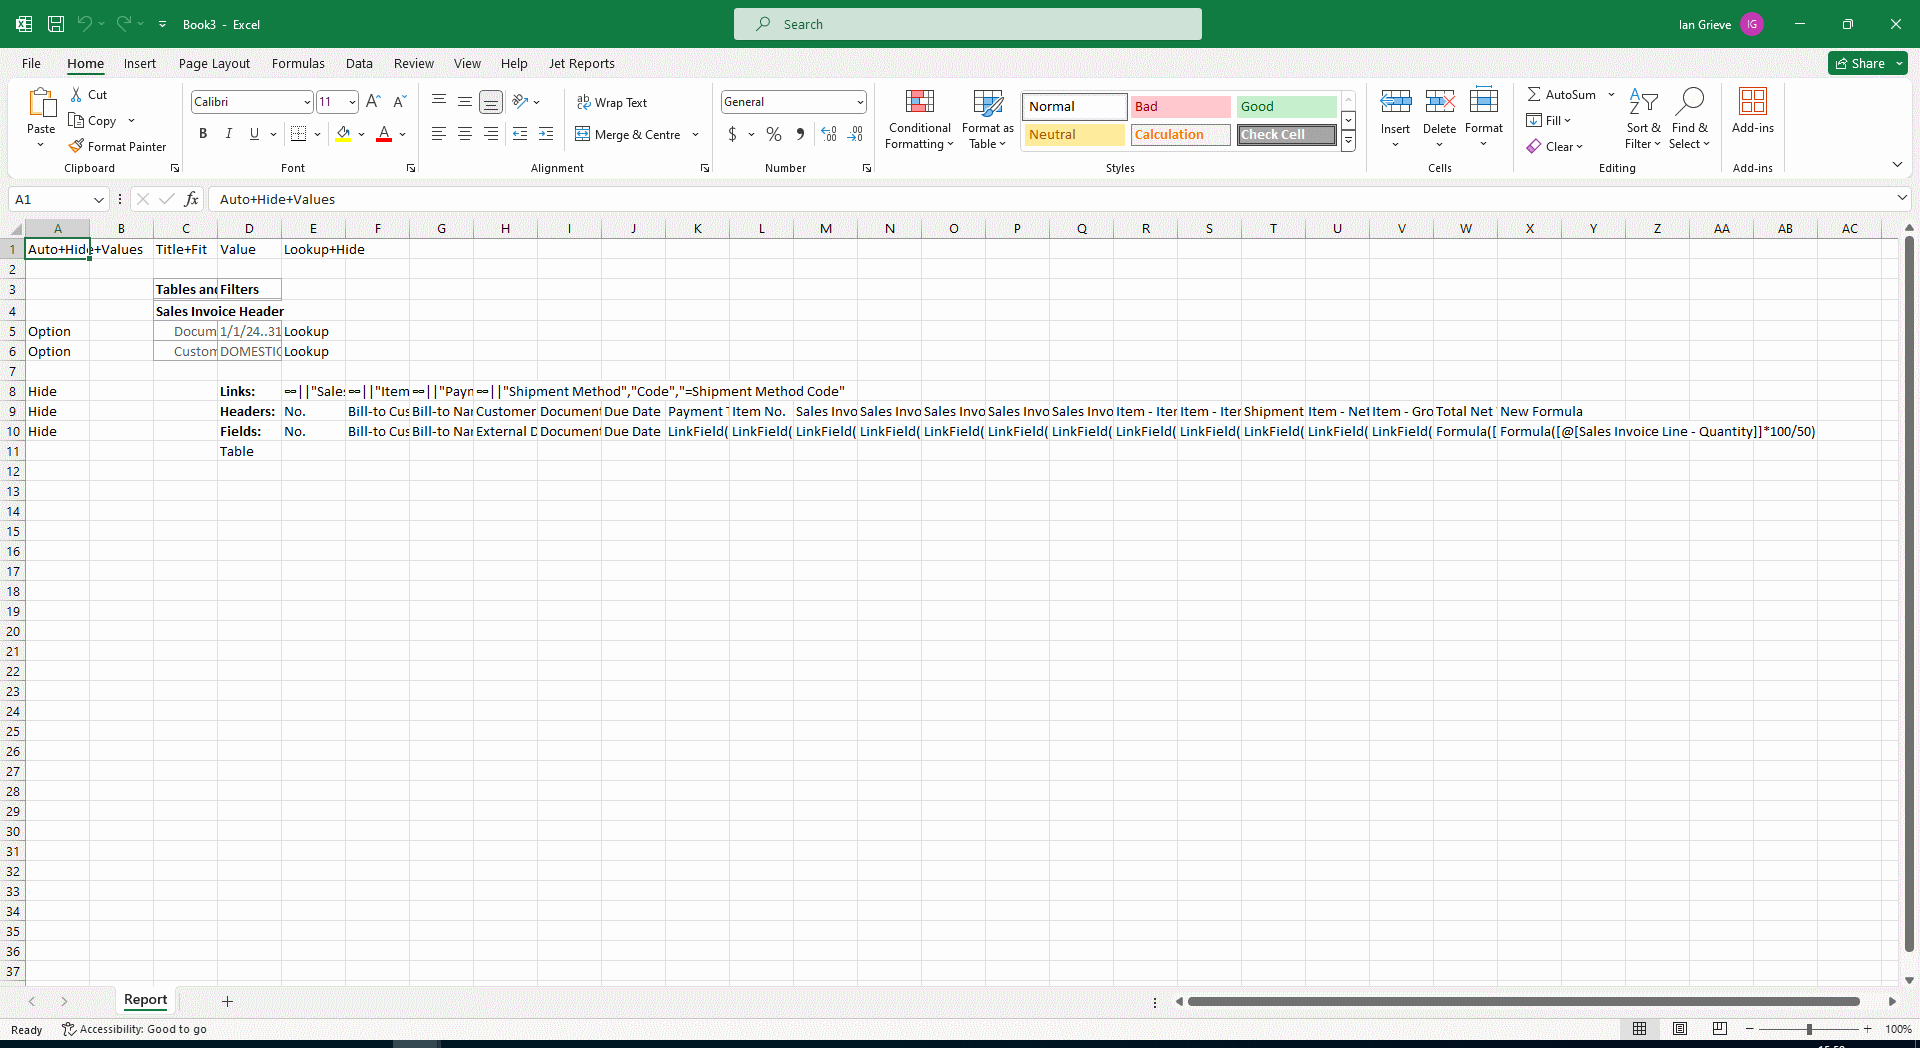
When the Table Builder is closed, the Excel worksheet will be populated with the configured report; you can make changes at this stage if desired, but none of these changes will be in the saved template:
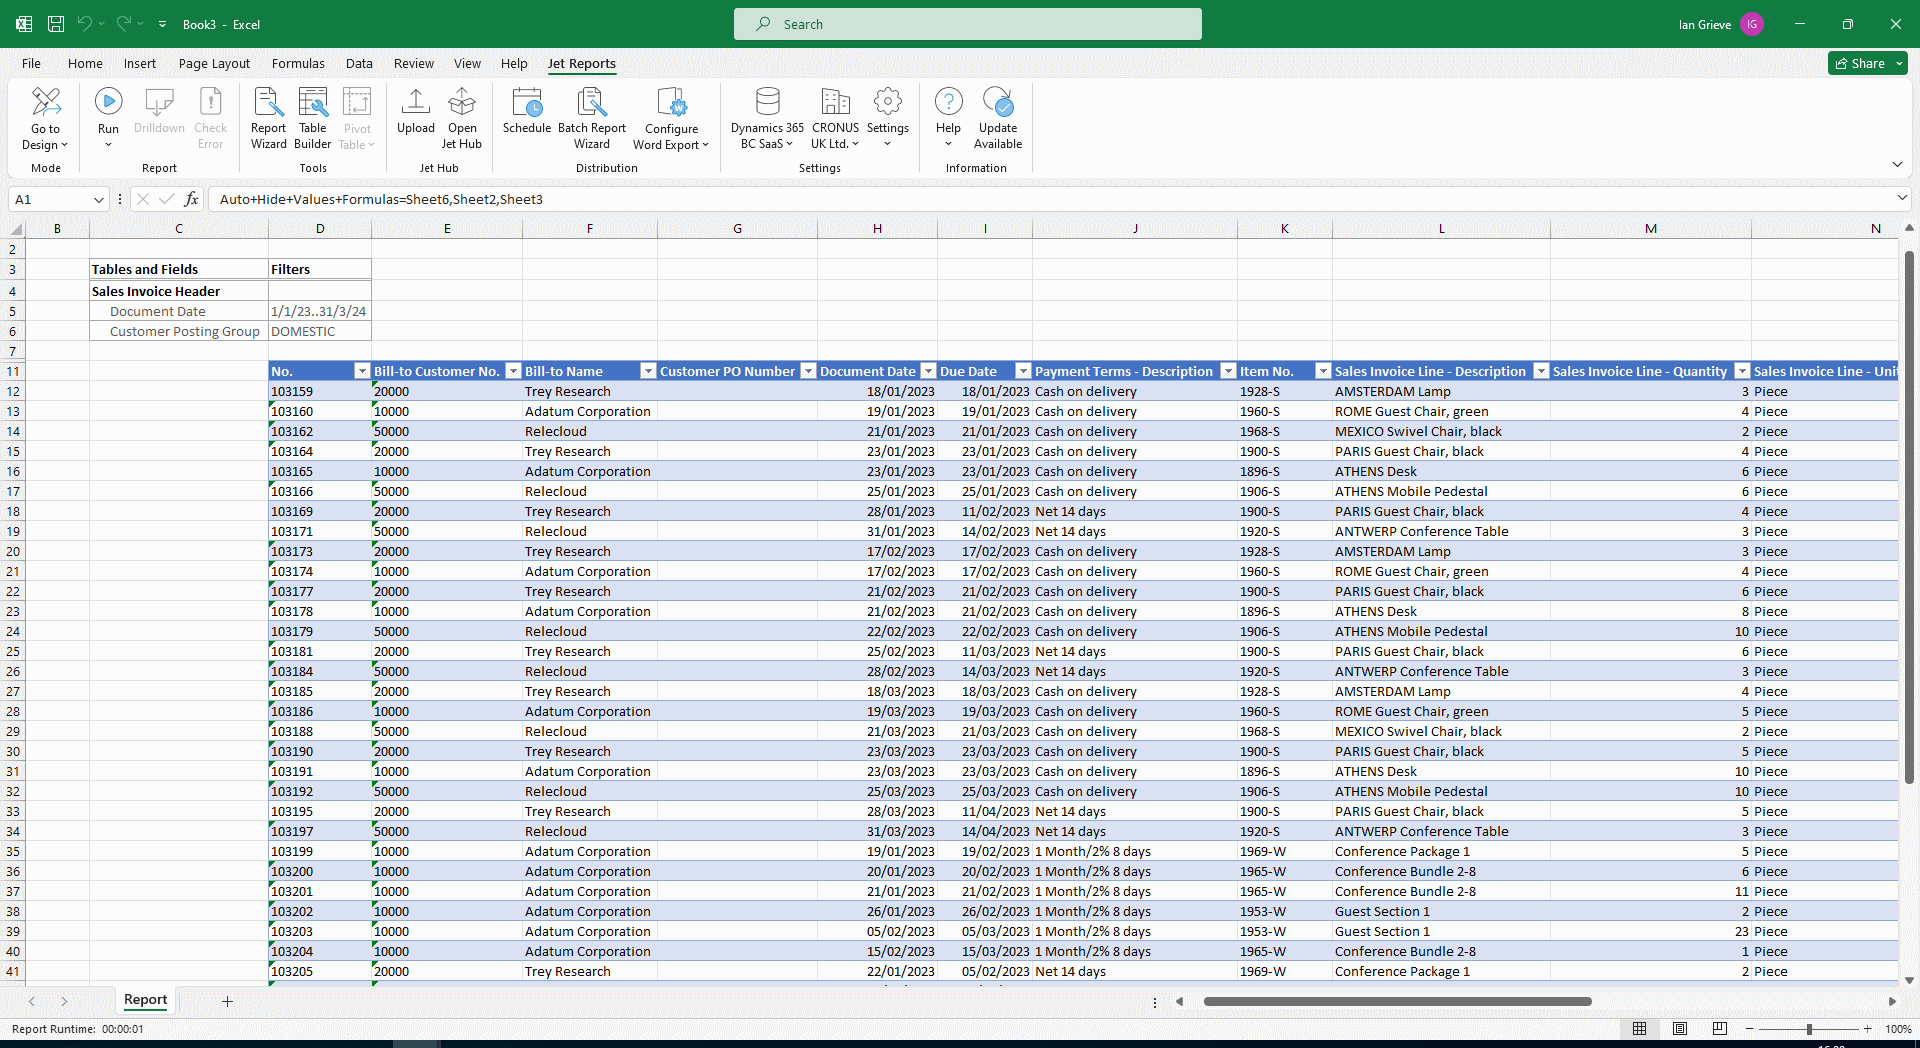
When the user runs the report they can select any configured options and then the report will generate:
Conclusion ^
I’ve always tended to create reports using the Jet function (Jfx) as it is the most flexible way to create reports, but I recently had need to create a report using Table Builder for a client where we wanted to connect a PivotTable to the report and found Table Builder to be much more useful than I had remembered, which is what prompted me to cover it in depth within the webinar.
The webinar recording is available here.
I have a book available now called Jet Reports with Microsoft Dynamics 365 Business Central; this book is aimed at end-users or consultants looking to use Jet Reports with Microsoft Dynamics 365 Business Central for financial and/or operational reporting.
The book covers the basics of installing and configuring Jet Reports as well as how to design and build reports using the Excel Add-in, before moving on to step-by-step guides on creating six different types of report and closing with a look at the report building tools, Jet Hub and report distribution.
The book is available as an eBook direct from my azurecurve Publishing site (always with a discount of $5, but with an additional discount of 20% until end of April using voucher code EASTER2024) or from Amazon:
What should we write about next?
If there is a topic which fits the typical ones of this site, which you would like to see me write about, please use the form, below, to submit your idea.


