 With Business Analyzer R5 installed it’s time to take a look.
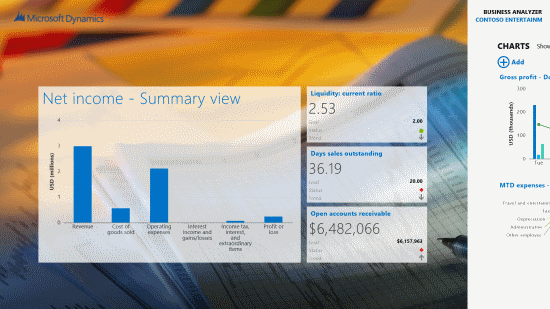
Clicking the tile will launch the app which will show a Net Income – Summary view and, as is standard in Microsoft apps, a slice of the next part of the app:
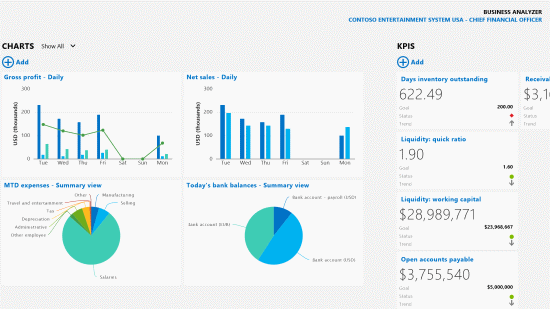
Swiping to the side loads up the Charts display which includes sample data from the Contoso company, and the first slice of KPIs:
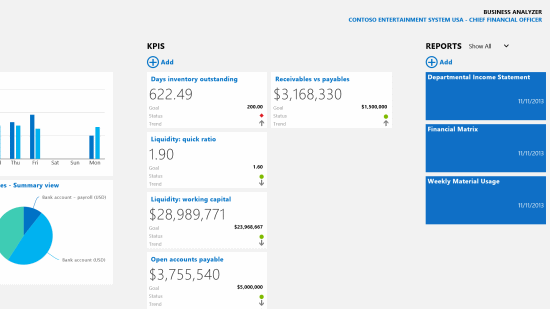
Swiping again displays all of the KPIs and a selection of report tiles:
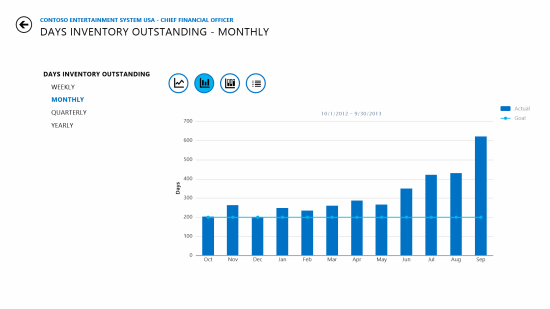
Clicking/tapping on one of the KPIs, such as Days inventory outstanding will load the detail behind the report:
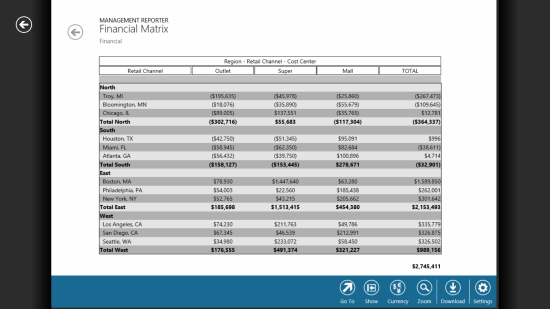
Hitting the back button in the top right corner returns you to the KPIs page. Clicking on one of the report tiles will launch a Management Reporter report which fnctions just like the Management Reporter Web Viewer:
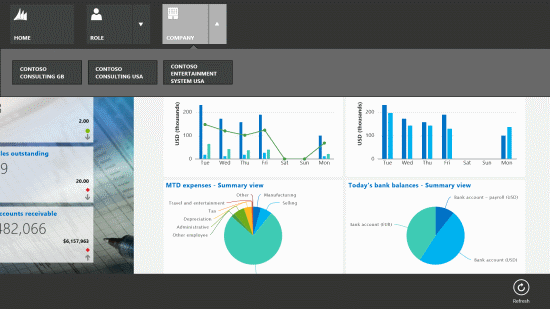
One other nice feature in the app, is when you right click a menu is displayed which allows the data to be changed by selecting a different role, or company:


